
Even though Green Landscaping Group (STO:GREEN) has lost kr354m market cap in last 7 days, shareholders are still up 96% over 3 years
Green Landscaping Group AB (publ) (STO:GREEN) shareholders might be concerned after seeing the share price drop 15% in the last month. But don’t let that distract you from the very nice return generated over three years. In the last three years the share price is up, 85%: better than the market.
In light of the stock dropping 10% in the past week, we want to investigate the longer term story, and see if fundamentals have been the driver of the company’s positive three-year return.
See our latest analysis for Green Landscaping Group
While the efficient markets hypothesis continues to be taught by some, it has been proven that markets are over-reactive dynamic systems, and investors are not always rational. By comparing earnings per share (EPS) and share price changes over time, we can get a feel for how investor attitudes to a company have morphed over time.
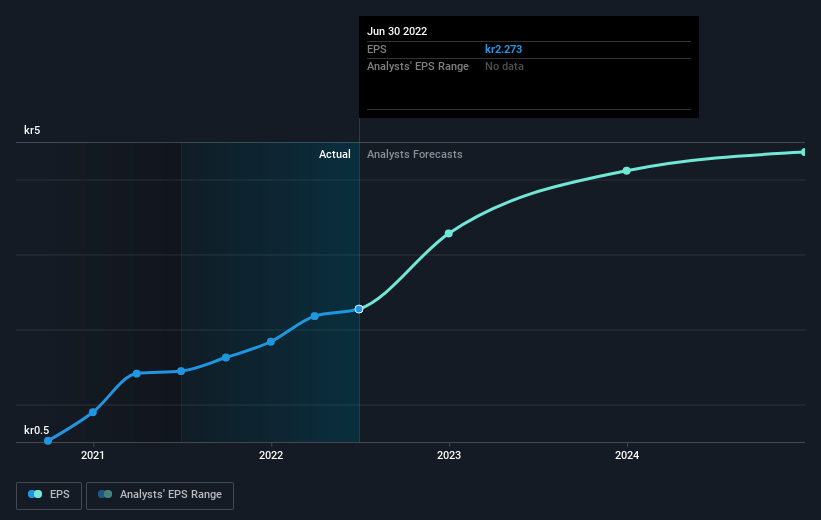
During three years of share price growth, Green Landscaping Group moved from a loss to profitability. That would generally be considered a positive, so we’d expect the share price to be up.
The image below shows how EPS has tracked over time (if you click on the image you can see greater detail).
OM:GREEN Earnings Per Share Growth September 23rd 2022
It is of course excellent to see how Green Landscaping Group has grown profits over the years, but the future is more important for shareholders. If you are thinking of buying or selling Green Landscaping Group stock, you should check out this FREE detailed report on its balance sheet.
What About The Total Shareholder Return (TSR)?
Investors should note that there’s a difference between Green Landscaping Group’s total shareholder return (TSR) and its share price change, which we’ve covered above. The TSR is a return calculation that accounts for the value of cash dividends (assuming that any dividend received was reinvested) and the calculated value of any discounted capital raisings and spin-offs. Green Landscaping Group hasn’t been paying dividends, but its TSR of 96% exceeds its share price return of 85%, implying it has either spun-off a business, or raised capital at a discount; thereby providing additional value to shareholders.
A Different Perspective
The last twelve months weren’t great for Green Landscaping Group shares, which performed worse than the market, costing holders 33%. The market shed around 28%, no doubt weighing on the stock price. Fortunately the longer term story is brighter, with total returns averaging about 25% per year over three years. The recent sell-off could be an opportunity if the business remains sound, so it may be worth checking the fundamental data for signs of a long-term growth trend. I find it very interesting to look at share price over the long term as a proxy for business performance. But to truly gain insight, we need to consider other information, too. Even so, be aware that Green Landscaping Group is showing 2 warning signs in our investment analysis and 1 of those doesn’t sit too well with us…
For those who like to find winning investments this free list of growing companies with recent insider purchasing, could be just the ticket.
Please note, the market returns quoted in this article reflect the market weighted average returns of stocks that currently trade on SE exchanges.
Have feedback on this article? Concerned about the content? get in touch with us directly. Alternatively, email editorial-team (at) simplywallst.com.
This article by Simply Wall St is general in nature. We provide commentary based on historical data and analyst forecasts only using an unbiased methodology and our articles are not intended to be financial advice. It does not constitute a recommendation to buy or sell any stock, and does not take account of your objectives, or your financial situation. We aim to bring you long-term focused analysis driven by fundamental data. Note that our analysis may not factor in the latest price-sensitive company announcements or qualitative material. Simply Wall St has no position in any stocks mentioned.
Valuation is complex, but we’re helping make it simple.
Find out whether Green Landscaping Group is potentially over or undervalued by checking out our comprehensive analysis, which includes fair value estimates, risks and warnings, dividends, insider transactions and financial health.
View the Free Analysis
Comments are closed.